
PELONI: This is a very important read, which should be considered carefully and shared widely.
Click Image to Enlarge. Image created via AI.
Take a trip down the rabbit hole of basing significant reporting on assumed presumptions, and you’ll find yourself standing in front of a single spreadsheet wearing six different logos.
Since the election night of November 3, a number has circulated as if it held the weight of certified and settled fact: roughly 67 percent of Jewish voters backed Democrats this cycle. Appearing across major Main Stream Media reporting, shared across advocacy press releases, and bandied about amid the casual back-and-forth debates which comprise polarized post-mortems, this claim has carried with it a particularly significant weight because it revives an accepted media narrative in which it is accepted as assumed fact that American Jews vote as a bloc, providing a safety net for the Left which is substantiated via the authority of polling data.
What it does not carry is any independent verification supporting these findings.
The commentary below provides a careful discussion of the 67% figure, where that number actually originates, what the methodology notes do and do not disclose, and how a single advocacy-sponsored survey of 482 early voters in Michigan came to act as the load-bearing pillar for the continuation of an established narrative that Jews vote for the Left no matter how dangerous doing so might be for them. The corollary to this narrative, of course, is that they deserve whatever mistreatment might come from their poor judgement, as well as deterring Republicans from any attempt in attracting such a stubbornly resistant subset who won’t respond to even the most concerning of threats when casting their votes.
The findings here are not that the underlying claim is false. Instead, what is discussed below is arguably something even more uncomfortable, ie, the evidence being cited to eastablish that the Jews are a captured arm of the Democratic party is far less established than is being implied in the constant reference to, and repetition of, the reported 67% of Jews supporting a political party which is clearly ignoring their interests.
The devil remains in the details, and the details as discussed below are themselves quite revealing to the debate over Jewish support for such candidates as Michigan’s Sayed.
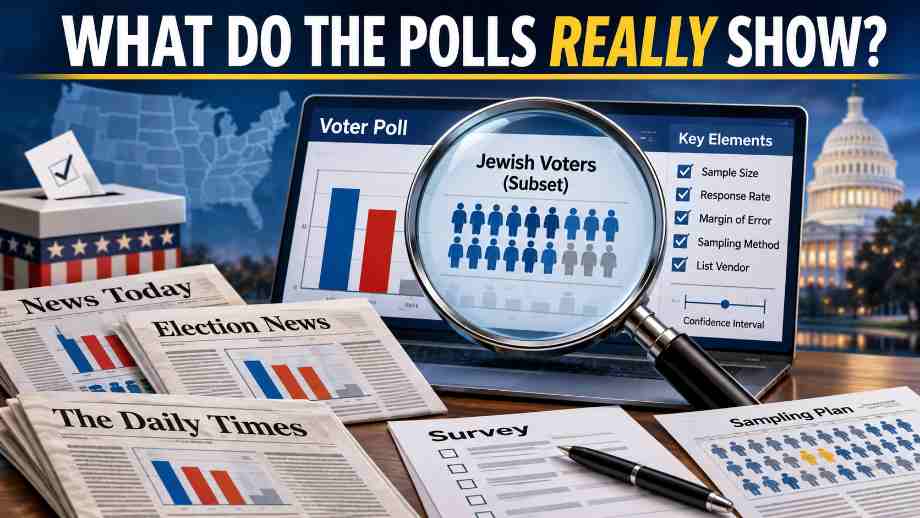
In my former life I was a Statistician and a Silicon Valley based Data Scientist, so let me answer definitively that the whole premise that Jews voted for Democrats (and the first Openly Muslim senator) is nothing but the latest trope…
What the polls actually show about Jewish… https://t.co/0VKWMKRZCU pic.twitter.com/7NVgrhfcVy
— SGM (@sgmlabs) November 4, 2026
Text:
In my former life I was a Statistician and a Silicon Valley based Data Scientist, so let me answer definitively that the whole premise that Jews voted for Democrats (and the first Openly Muslim senator) is nothing but the latest trope…
What the polls actually show about Jewish voters in 2026 (and what they don’t):
The national number everyone is repeating
Since election night, I’ve seen the same statistic pop up everywhere: Jewish voters went roughly 67% Democratic this cycle. It shows up in NBC’s exit poll coverage, in advocacy group press releases, in casual conversation as settled fact.I spent a few hours this week tracing where that number actually comes from, and I want to walk through what I found, because the real picture is a lot THINNER than “multiple polls confirm it” suggests.
Start with the “EXIT POLL” framing itself. When NBC, CBS, CNN, AP, and Fox each report a Jewish voter breakdown this cycle, it looks like 5 separate confirmations of the same fact. It isn’t.
All 5 outlets are publishing numbers from a single shared vendor, SSRS, running one (that’s right, ONE) survey called the Voter Poll on behalf of the entire consortium. Six network bylines on the same spreadsheet is not five independent checks on a finding. It’s one measurement with six press releases attached to it, all branded under their individual media names.
The advocacy-side polls have the same problem in miniature. The Jewish Voters Resource Center’s poll and the Jewish Electorate Institute’s poll both get cited as separate corroborating evidence. Both were fielded by the same polling firm, GBAO Strategies.
Two sponsor logos, two press releases, one survey house running both instruments.
When I actually counted the genuinely independent measurement operations behind the “five polls all agree” claim, I got 2 (3 tops), not five.
This matters more than it sounds like, because polarized elections have a documented history of this exact failure mode.
In 2004, the national exit polls significantly overstated John Kerry’s support, and the pollster’s own post-election review traced a large chunk of the error to Republican voters that year being less willing to stop and talk to an exit poll interviewer than Democratic voters were.
A bigger sample would not have fixed that problem. Only a different design would have.
The same mechanism applies here: a poll asking Jewish voters about their choice in an unusually bitter, identity-charged race is exactly the kind of survey where willingness to answer at all might correlate with the answer itself – i.e. republican-voting Jews never self-identify, etc.
But above is just skimming the surface. Now, for the real Statistics. As the famous saying goes: “Lies, damned lies, and statistics” – turns out, very applicable here:
It's always interesting when Jews have polling numbers in nanoseconds, but nobody else.
— Lily West? (@LilyRoslynWest) November 4, 2026
The part I think gets skipped entirely in every popular explanation of how this works, including the quote from some sources in Michigan state that “482 self-identified respondents” as proof the sample was representative.
Jews are about 2.4% of the US adult population. Picture a room of 1,000 people who just voted and got surveyed on the way out. Roughly 24 of them are actually Jewish.
Now picture one single person out of the other 976, the non-Jewish majority of the room, checking “Jewish” on the religion question by mistake. That’s right, an innocent mistake.
Maybe they misread the list of options. Maybe they clicked the wrong button near the end of a long phone interview. Maybe they thought it was a joke question.
…It doesn’t really matter why…
One stray answer like that barely registers in a room of 1,000 people.
But scale that same error rate, one misclick in a thousand, up to a poll of 100,000 people, which is roughly the size of this cycle’s national Voter Poll.
That tiny error rate alone adds about 100 non-Jewish respondents into the “Jewish” bucket. Compare that against the true Jewish subgroup of around 2,400 people in that same sample.
An error that was invisible at small scale is now a meaningful fraction of the group you’re trying to measure.
This is the same math behind why a cheap screening test for a rare disease produces a surprising number of false positives even when the test itself sounds accurate.
When the group you care about is rare, a small error rate in the much larger group of people who aren’t in it can swamp your signal.
If the people who mistakenly get counted as a Jewish vote roughly like the general electorate, mixing them in would pull the measured number toward the national average and away from the true Jewish preference, meaning the 65 to 75 percent range could understate Jewish Democratic support rather than overstate it.
No one today citing the topline number knows the answer to the above issue – because none of the public releases show the raw data needed to check it.
None of the political pollsters behind this cycle’s headline numbers publish a response rate at all.
In Pew Research Center’s 2020 study of Jewish Americans, only 1 out of 6 Jews polled responded.
Is it still 1 out of 6 in this election – or were the results entirely skewed by mostly democrat-voting responders?
In the same 2020 election study, it was proven that 75 percent of Orthodox Jews identified as Republican or Republican leaning, compared to roughly 70 percent Democratic for Jewish adults as a whole.
This means that the choice of polling method matters:
– exclude synagogue-going members => democrat-leaning
– include only synagogue-going members => republican-leaningA poll’s choice of list vendor can swing the final number by DOUBLE digits depending on how well that list happens to represent Orthodox respondents relative to secular or unaffiliated ones.
So where does that leave the claim?
Here is the full list of holes I’d want closed before treating 67 percent as a solid number rather than a reasonable estimate:
– No pollster discloses how its “likely Jewish” contact list was actually built, whether from surname modeling, synagogue rosters, or donor files, and each method samples a meaningfully different slice of the community.
– No pollster except Pew discloses a response rate, and Pew’s own rate was 16.6 percent. We have no idea how the political polls compare, and low response in a polarized, high-salience race is exactly the condition under which opinion itself can predict who bothers to answer.
– No pollster shows the exact wording of its religion screener. A single yes-or-no item behaves very differently from a more elaborate “Do you eat Kosher food?”, and the public releases don’t tell us which kind of question any of this cycle’s polls actually used.
– There is no fully independent measurement of the Jewish vote for this specific election.
– Nobody publishes microdata, so nobody outside the pollster can check the false positive arithmetic I walked through above against the actual dataset. We are trusting a topline number that cannot currently be audited.
Now, I want to talk about Michigan state specifically
If the national claim has some real, if overstated, support behind it, the Michigan claim doesn’t have much support at all.
The specific assertion is that Jewish voters predominantly backed Abdul El-Sayed over Mike Rogers in the Senate race, and the evidence offered for it is a poll of 482 Jewish early voters conducted October 25 to 31 on behalf of a group called The Jewish Majority. I read that poll’s own published methodology directly rather than relying on how it got summarized in the press, and a few things stand out immediately.
First, the sponsor. The Jewish Majority is a Washington-based advocacy organization whose explicit mission involves pushing back on what it sees as the Democratic Party’s treatment of Jewish concerns.
That doesn’t make its numbers false, but a finding that happens to support the sponsor’s existing narrative, that a Democratic Senate nominee badly underperformed a fellow Democrat among Jewish voters specifically because of antisemitism concerns, is the kind of result that calls for independent replication before anyone treats it as settled. They have an incentive to make their group larger than it really is.
I looked for a second poll measuring the Jewish vote specifically in this race and could not find one. The entire public narrative about Jewish voters in Michigan rests on this single survey by a pro-democrat agency. READ THAT AGAIN! ??
Second, the pollster. This was run by Mercury Public Affairs, a political consulting firm, not by Edison Research or SSRS, the organizations that run the standard exit polling infrastructure for the major networks.
Multiple outlets, including Jewish Insider and Forward, nonetheless described this survey as an “exit poll.” It fielded only among early and mail voters, before Election Day, before the race was decided, and before at least one notable late endorsement in the race.
It was NOT an “exit poll”.
Calling it an exit poll borrows credibility from a methodology it doesn’t actually use, and generalizing its findings to “the Jewish vote” in Michigan skips over the fact that early voters are a different population from Election Day voters, typically older and more habitually partisan.
Third, and most importantly, the sampling frame itself is never disclosed. The poll’s own methodology note tells us the sample was weighted by gender, age, geography, education, and recalled 2024 vote, and that respondents “identified as Jewish” when contacted.
What it never says is how the list of people to contact in the first place was built. Were they drawn from a voter file vendor’s statistical model of likely Jewish surnames and neighborhoods, from synagogue or Jewish organization membership rolls, from some combination of the two?
Or was the list just made up of pre-selected members of this democratic Jewish voters to begin with?
Nobody competent objects that they personally weren’t surveyed. The real question is how the pool of people eligible to be approached in the first place was assembled, because that pool was never a random slice of Michigan’s Jewish voters.
It was a list built by someone, using some method, and that method is not public.
A list-based targeted poll like this one risks systematically excluding people who are Jewish but don’t show up on whatever list was used: secular or unaffiliated Jews, intermarried households, people without a “listable” surname, recent movers, lower-propensity voters who’ve never donated to a Jewish organization or joined a synagogue. None of that exclusion is random.
And a bigger sample size doesn’t fix it, because the problem isn’t noise, it’s a systematically incomplete list.
Even taking the poll entirely at face value, the topline numbers mask how thin the underlying subgroups actually are.
The finding that “99 percent of self-identified Jewish Democrats who didn’t vote for El-Sayed would have voted for a different Democratic nominee” sounds precise, but that statistic is computed on a fraction of the 482 total respondents, likely somewhere in the range of 100 to 160 people once you filter down to Democrats who specifically rejected El-Sayed.
At that sample size, the real margin of error is closer to 8 to 13 percentage points, not the headline 4.9 points that only applies to the full, unfiltered sample.
The poll’s own methodology note acknowledges that subgroup estimates carry more uncertainty, without putting a number on it, which leaves most readers assuming the precision of the topline applies everywhere in the report. It doesn’t.
There’s also a quieter problem worth naming: even the secondary press coverage of this single poll doesn’t agree with itself. Some outlets reported El-Sayed at 57 percent and Rogers at 34 percent, matching the pollster’s own release.
Others reported El-Sayed at 60 percent and Rogers at 36 percent. That’s not a rounding difference, it’s two different numbers being treated as interchangeable facts by outlets covering the same underlying survey, which should be a signal to slow down before repeating either figure as precise.
So for the Michigan claim, here’s the full list of holes as I see them:
– a single advocacy-sponsored survey with no independent replication,
– a pollster that isn’t part of the standard exit polling infrastructure
– an undisclosed sampling methodology that almost certainly excludes meaningful parts of Michigan’s Jewish electorate in a non-random way
– subgroup statistics reported with topline-level confidence despite much smaller real sample sizes,
– a survey window limited to early voters rather than the full electorate,
– press coverage that can’t even agree on the basic numbers from the one poll everyone is citing.
This claim rests on far less than the national one does, and the national one already has more holes in it than its confident repetition suggests.
To sum up, don’t trust any of the reporting.
I’m not arguing either outcome is wrong. With Jews or without Jews, the actual outcome would likely be the same.
But the evidence being waved around to prove this centuries-old trope that Jews always vote socialists / etc is much weaker than the confident way it gets repeated.
Note that above argument was built without assumption of any wrongdoing.
Couple any of the above – like a random 1% mistaken identification – with actual desire for wrongdoing, and the results on any narrative are catastrophic. You can basically start to tell whatever story you want about Jews.
Regardless, the pattern in both cases is the same: a small group gets measured either by casting a wide net over the general population and asking people to self-identify into the group, or by building a targeted list of people assumed to belong to the group and confirming it when contacted.
Neither failure mode is fixed by a bigger sample or a tighter stated margin of error. Both require knowing exactly how the data was collected, and in nearly every case examined here, that information simply isn’t published.
Don’t believe every headline you read…
Israpundit is entirely dependent on readers support. Please help me continue educating people with the truth about what is going on in Israel and around the world.


Leave a Reply
You must be logged in to post a comment.